MarketLens

Market microstructure, made visible

The order book, on the chart.

Resting liquidity aggregated from nine venues and drawn where it sits. Every large executed trade on a live tape, with sound. Forced liquidations on their own strip. And a recorded history of all of it that no venue sells back.

Open source under AGPL-3.0 at github.com/devarashs/market-lens. Run it yourself, fork it, or contribute.

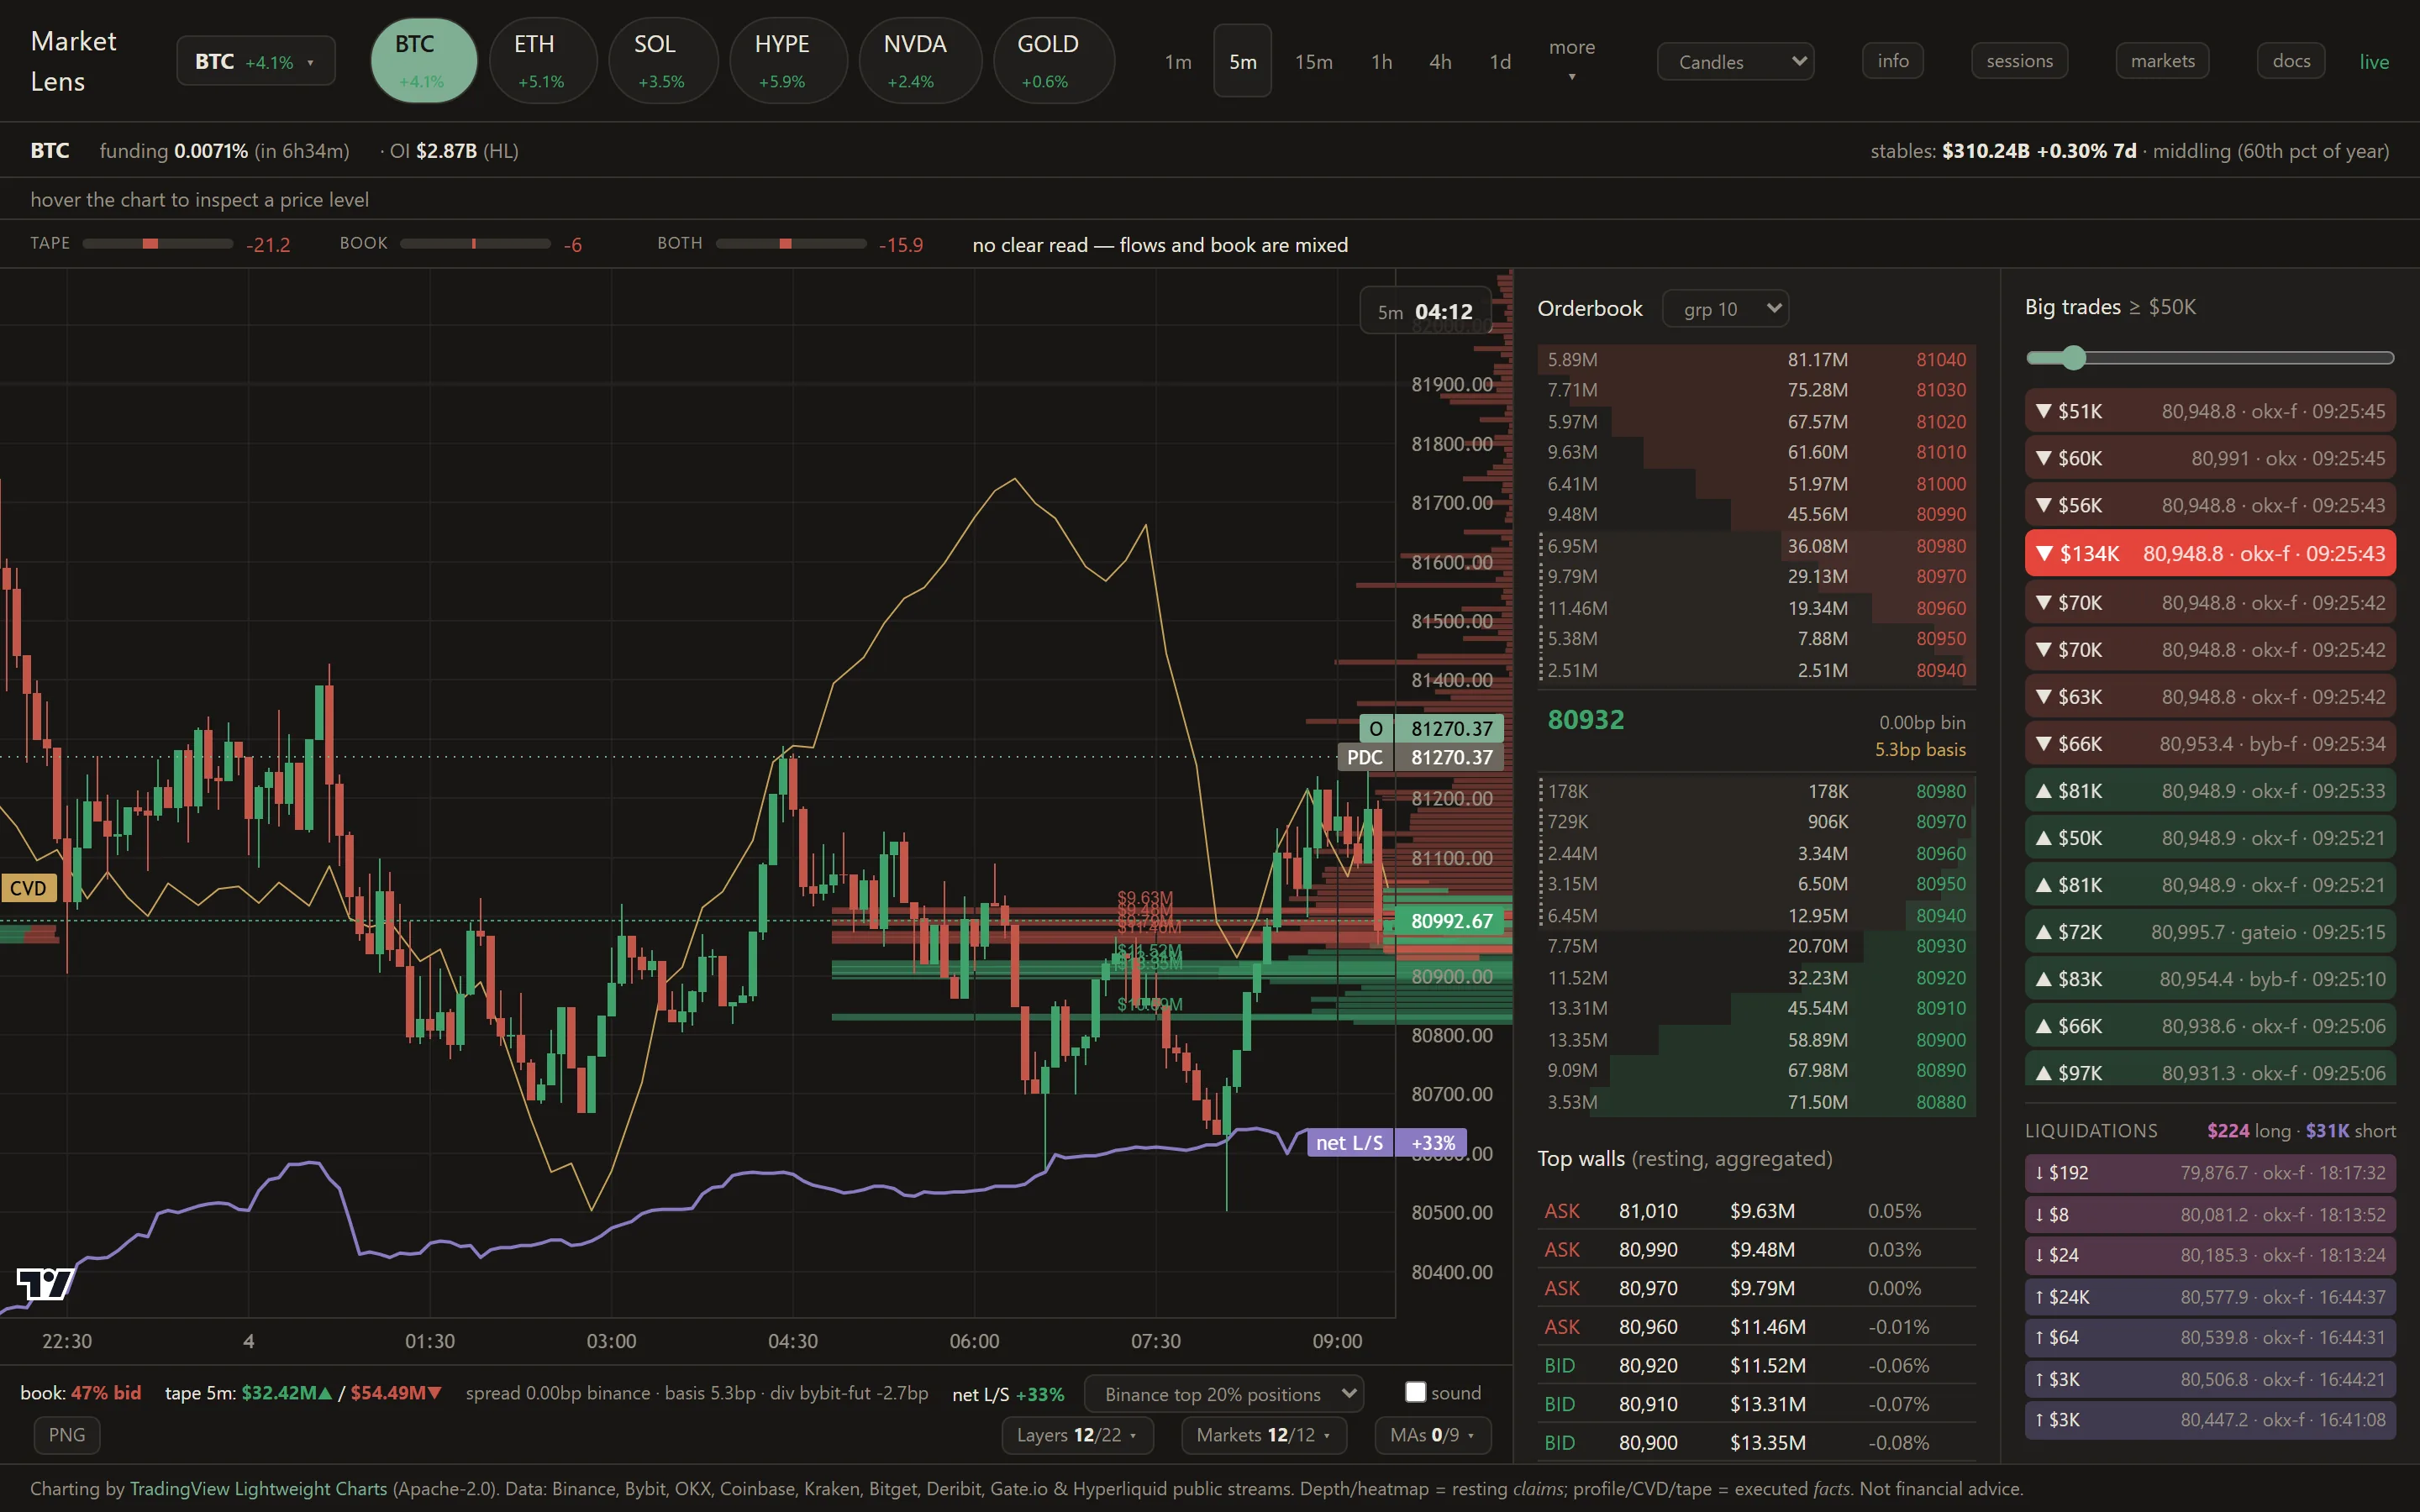
Market Lens showing BTC on a 5-minute chart: candles with a cross-venue depth overlay, CVD and net long/short lines, an aggregated order book with top walls, and a live tape of large trades with a liquidation strip beneath it.

The premise

Market structure is where the size sits.

Price gravitates toward large resting liquidity. Seeing that liquidity — across venues, at the price levels that matter for the symbol's scale — is the whole point.

Resting orders are claims. Executed prints are facts.

Walls get pulled; spoofing is real. So the two layers are never blended: what is resting and what has actually traded stay visually distinct on every surface.

What it shows

Depth on the chart, at the symbol's own scale

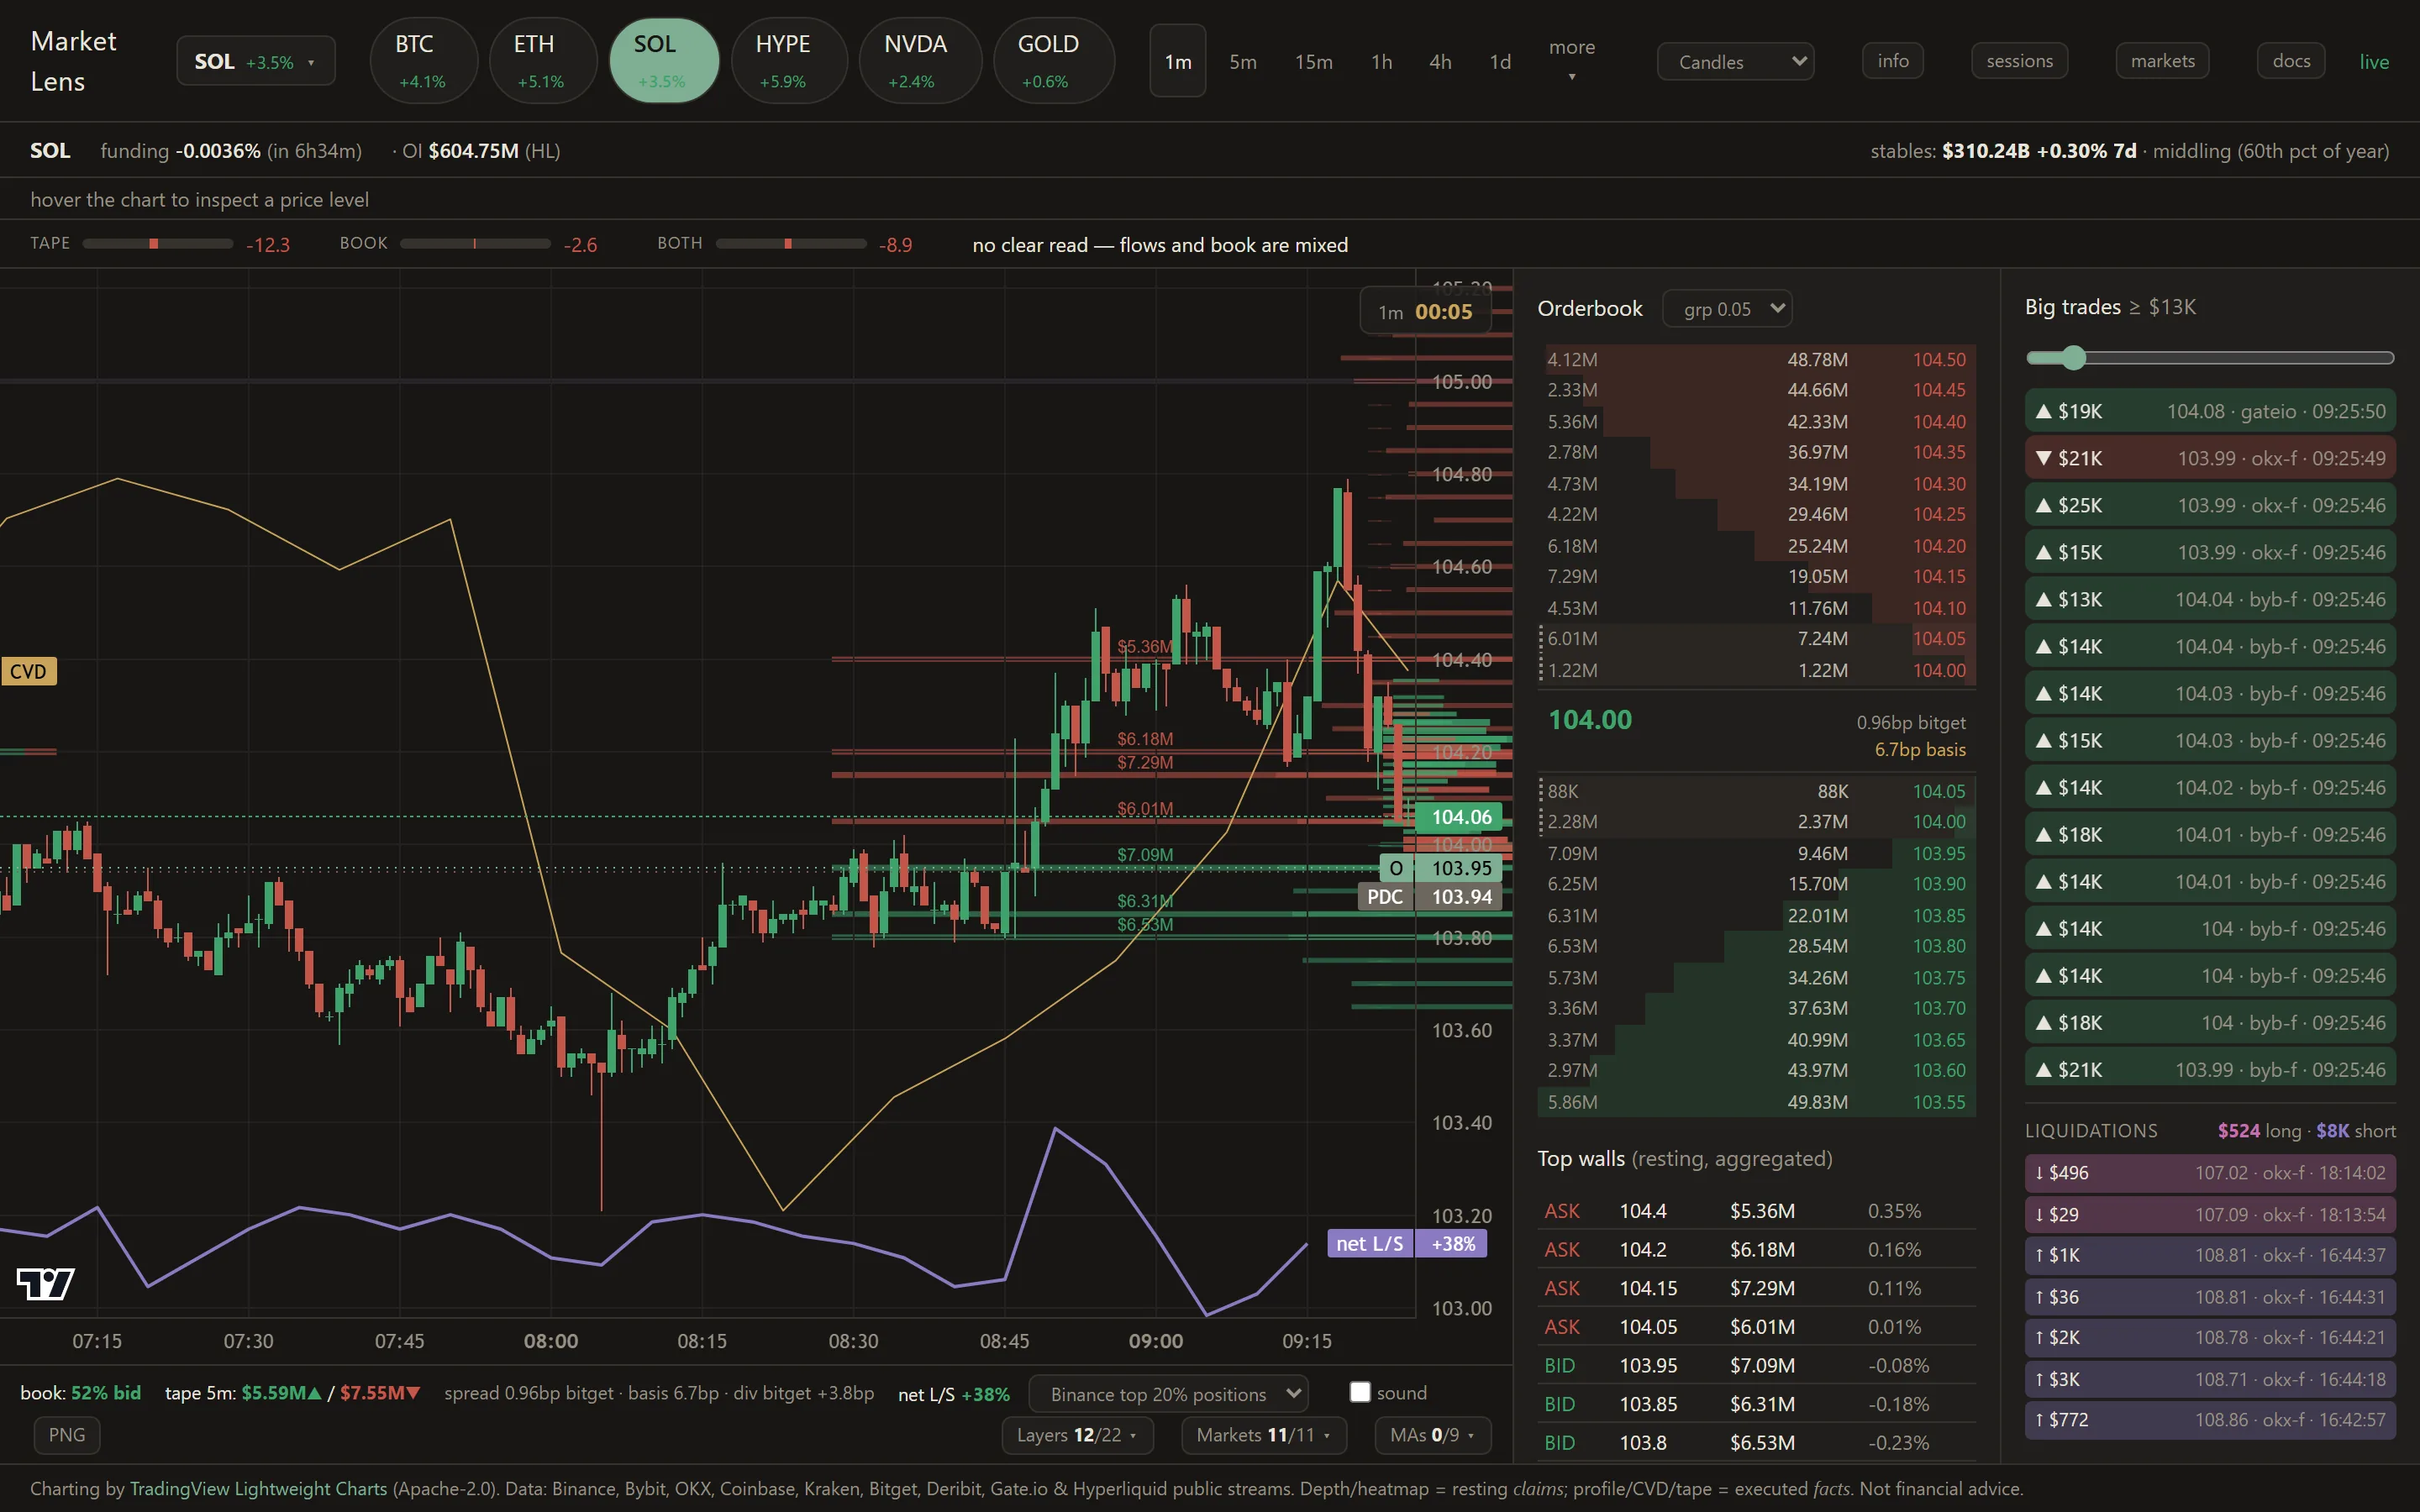
Notional-summed, price-binned depth drawn as bars beside price — grouped relative to the symbol, so a BTC book groups at $100 to $10,000 and a DOGE book at fractions of a cent. A liquidity heatmap behind price, volume profile, session VWAP, and an estimated liquidation-cluster map, each toggled independently.
16 timeframes, 1 second to 1 month · books built from up to 10,000 levels a side

SOL on a 1-minute chart with the depth overlay, heatmap and liquidation map layers visible.

One book, nine venues

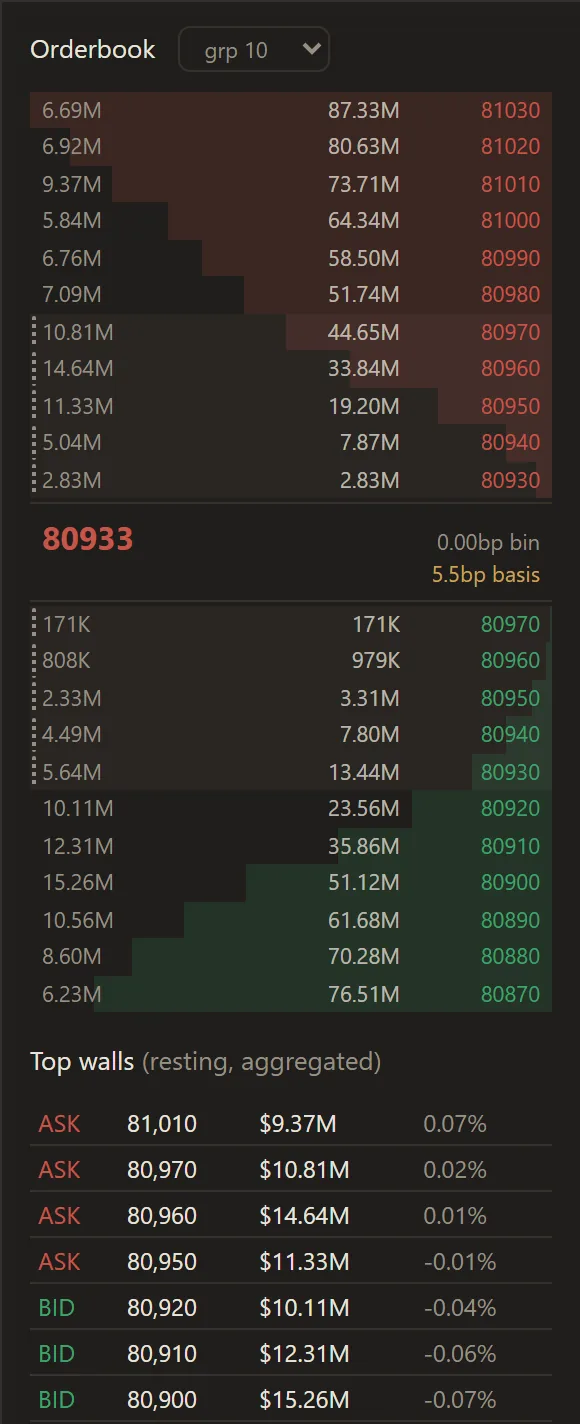
Spot and perpetual books from every connected venue, merged into one ladder with the basis between them shown rather than hidden. The largest resting walls are listed with their distance from mid — the levels a chart reader would otherwise have to hunt for.

Contract units converted per venue — OKX contract values, Deribit's USD-inverse sizing — and tested, because getting one wrong once produced phantom whales

The aggregated order book panel: asks above, bids below, the mid price with basis, and a table of the top resting walls with their distance from mid.

Tape you can hear

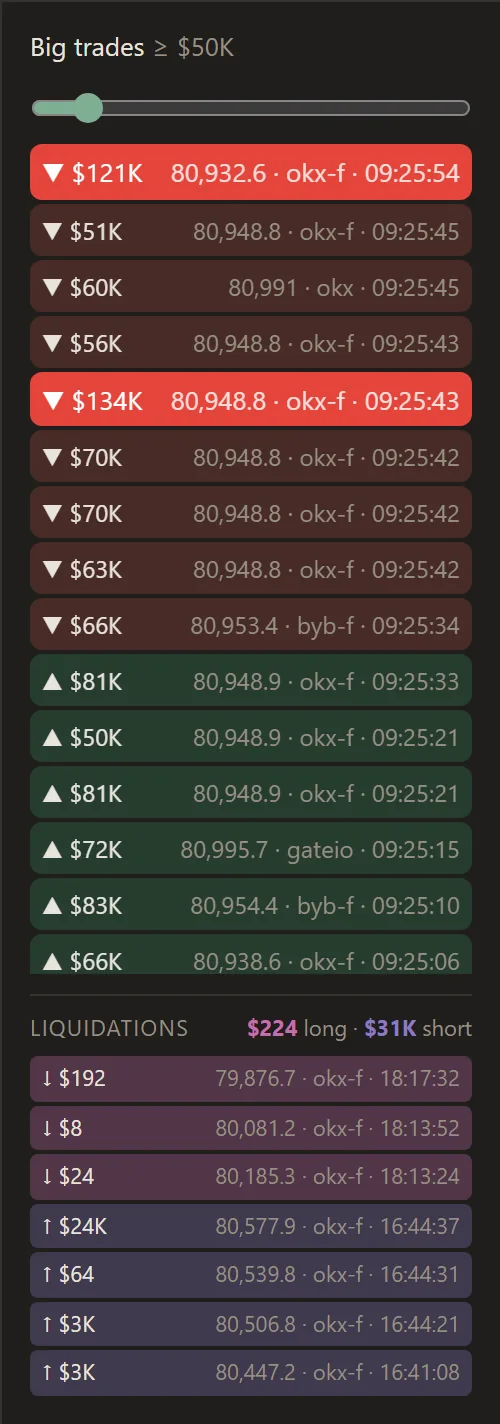
Every trade above a per-symbol notional threshold, sized and coloured by side and venue, with a scheduled WebAudio note per print — compressed and paced so a burst of prints reads as a burst, not a machine gun. Forced liquidations are kept on their own strip, never mixed into the tape.

Liquidations from Binance and OKX futures streams · adjustable threshold per symbol

The trade flow panel: a threshold slider, a tape of large prints with size, price, venue and time, and a separate liquidation strip beneath.

Where the flow is

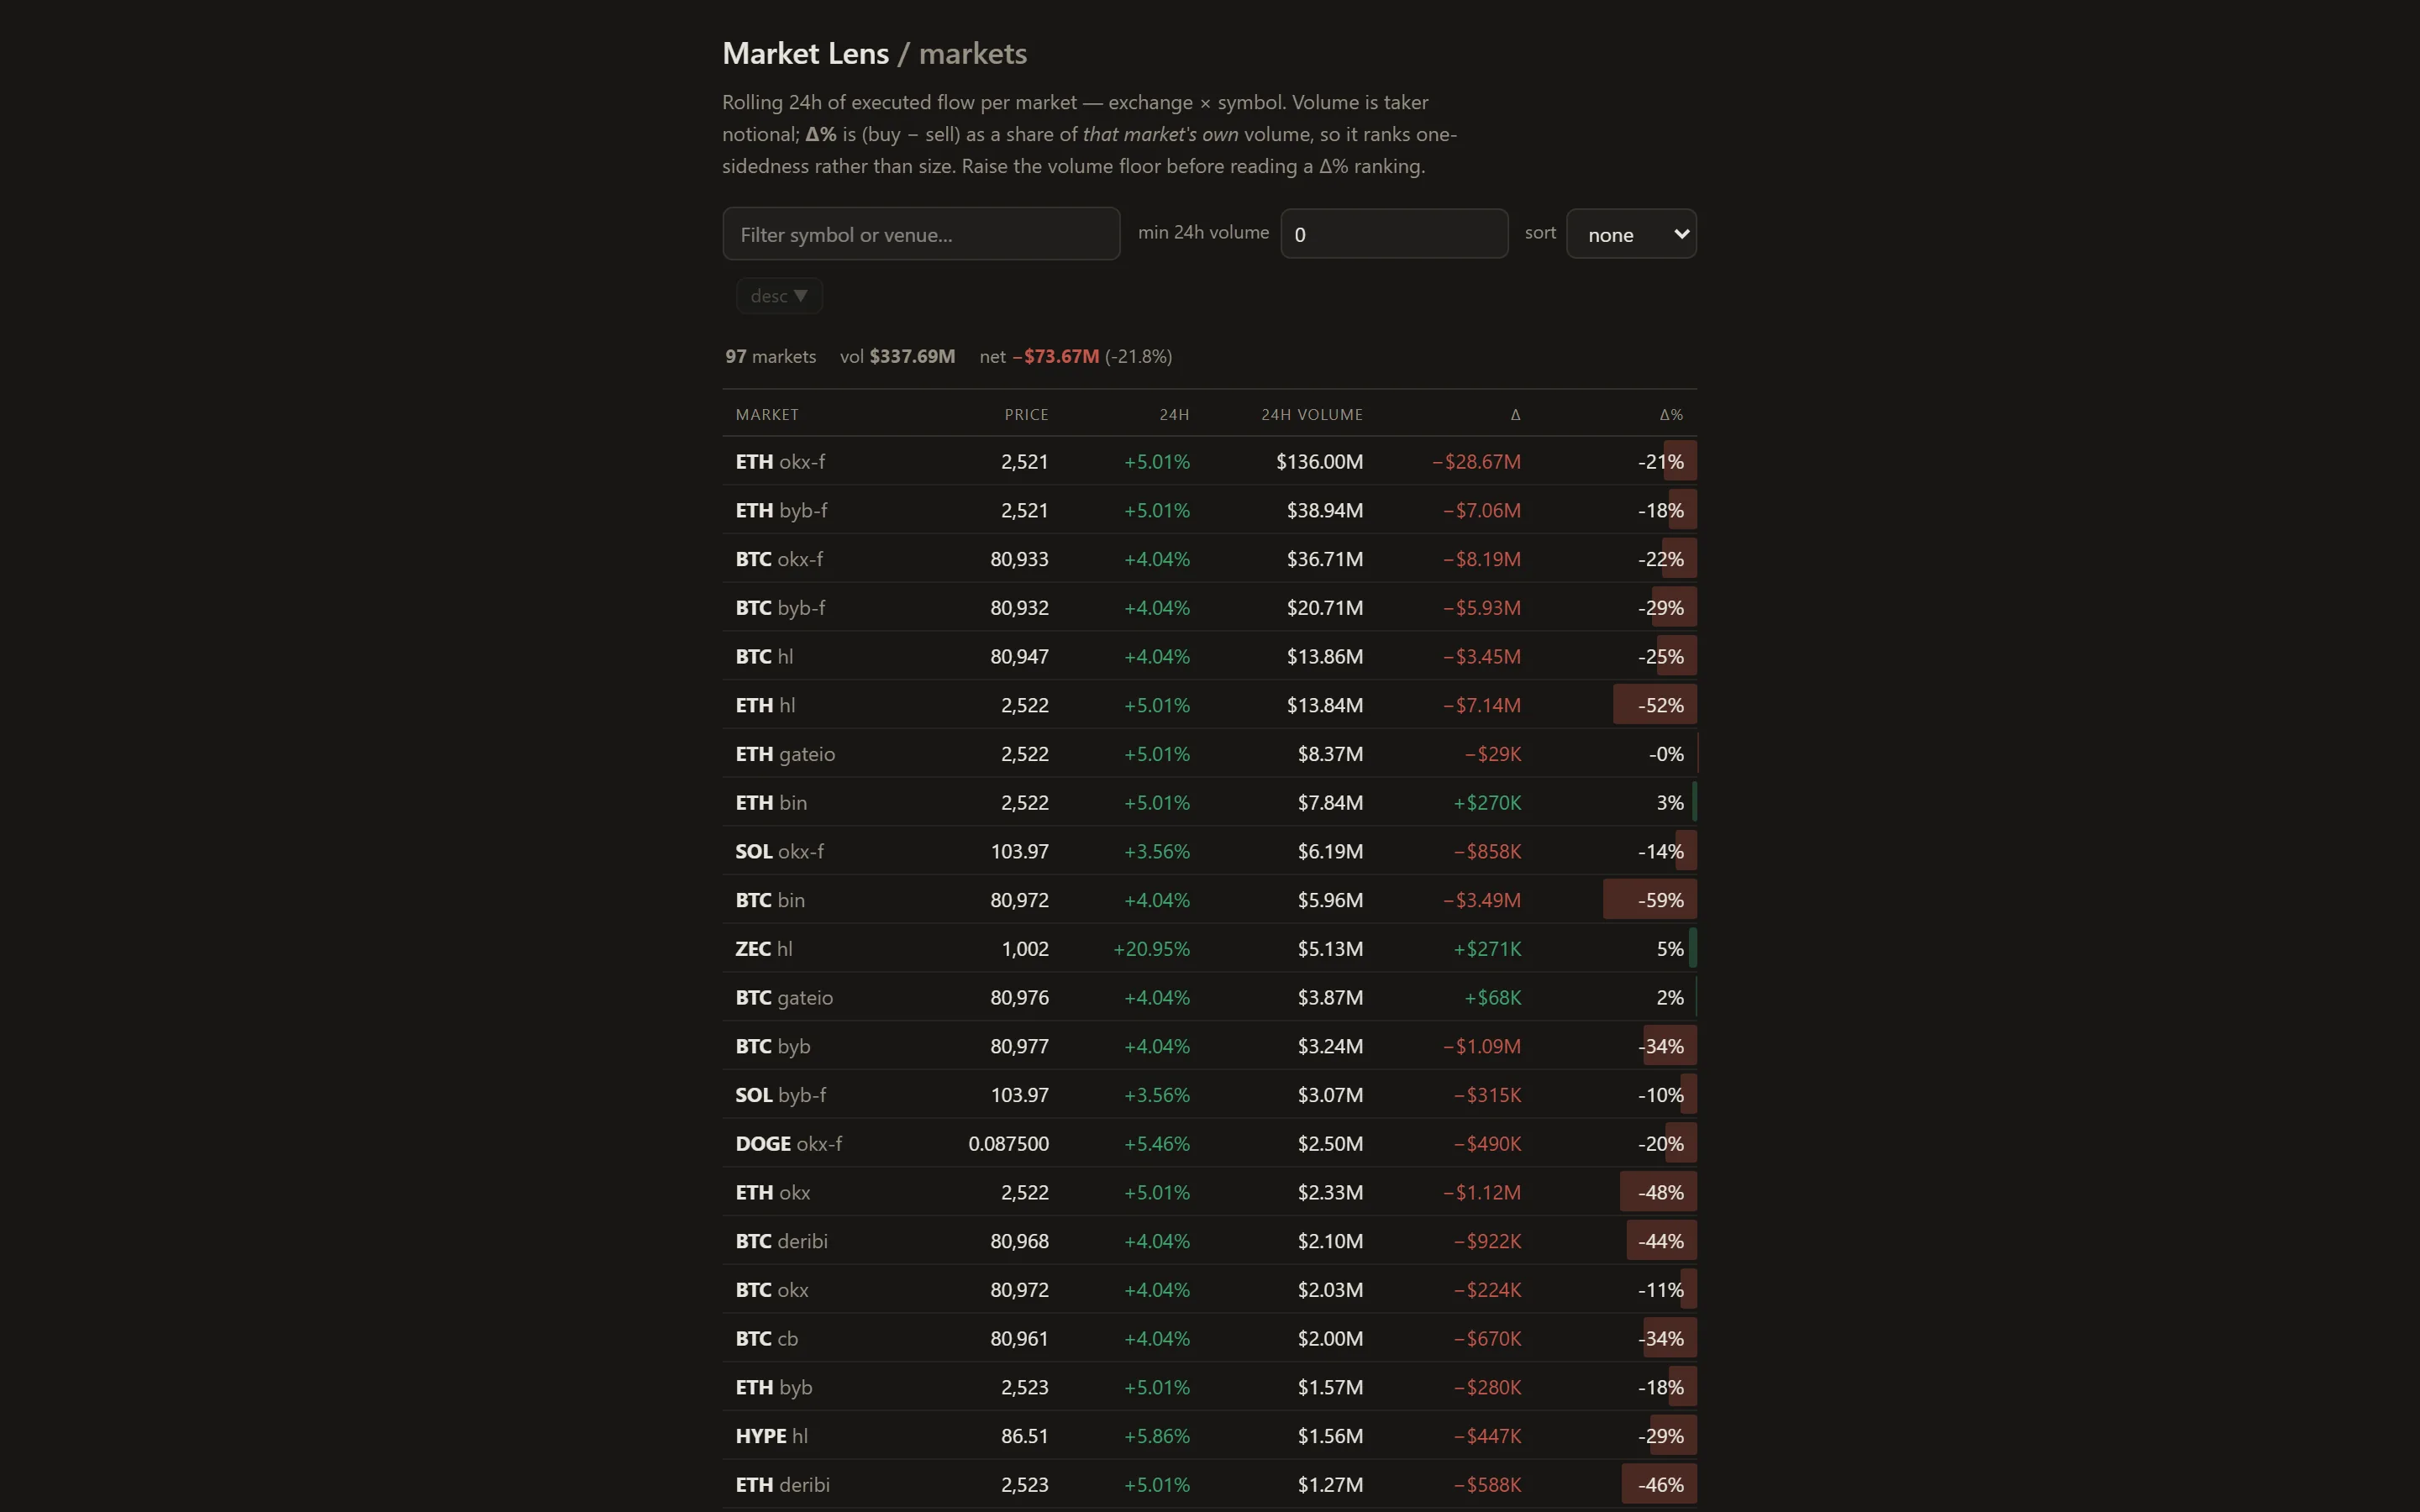
A rolling 24-hour table of executed flow per market — exchange by symbol — built from the collector's own recorded prints. Delta is shown as a share of that market's own volume, so it ranks one-sidedness rather than size.

The markets page: a sortable table of markets with price, 24-hour change, volume, net delta and delta as a share of volume.

Which desks are at work

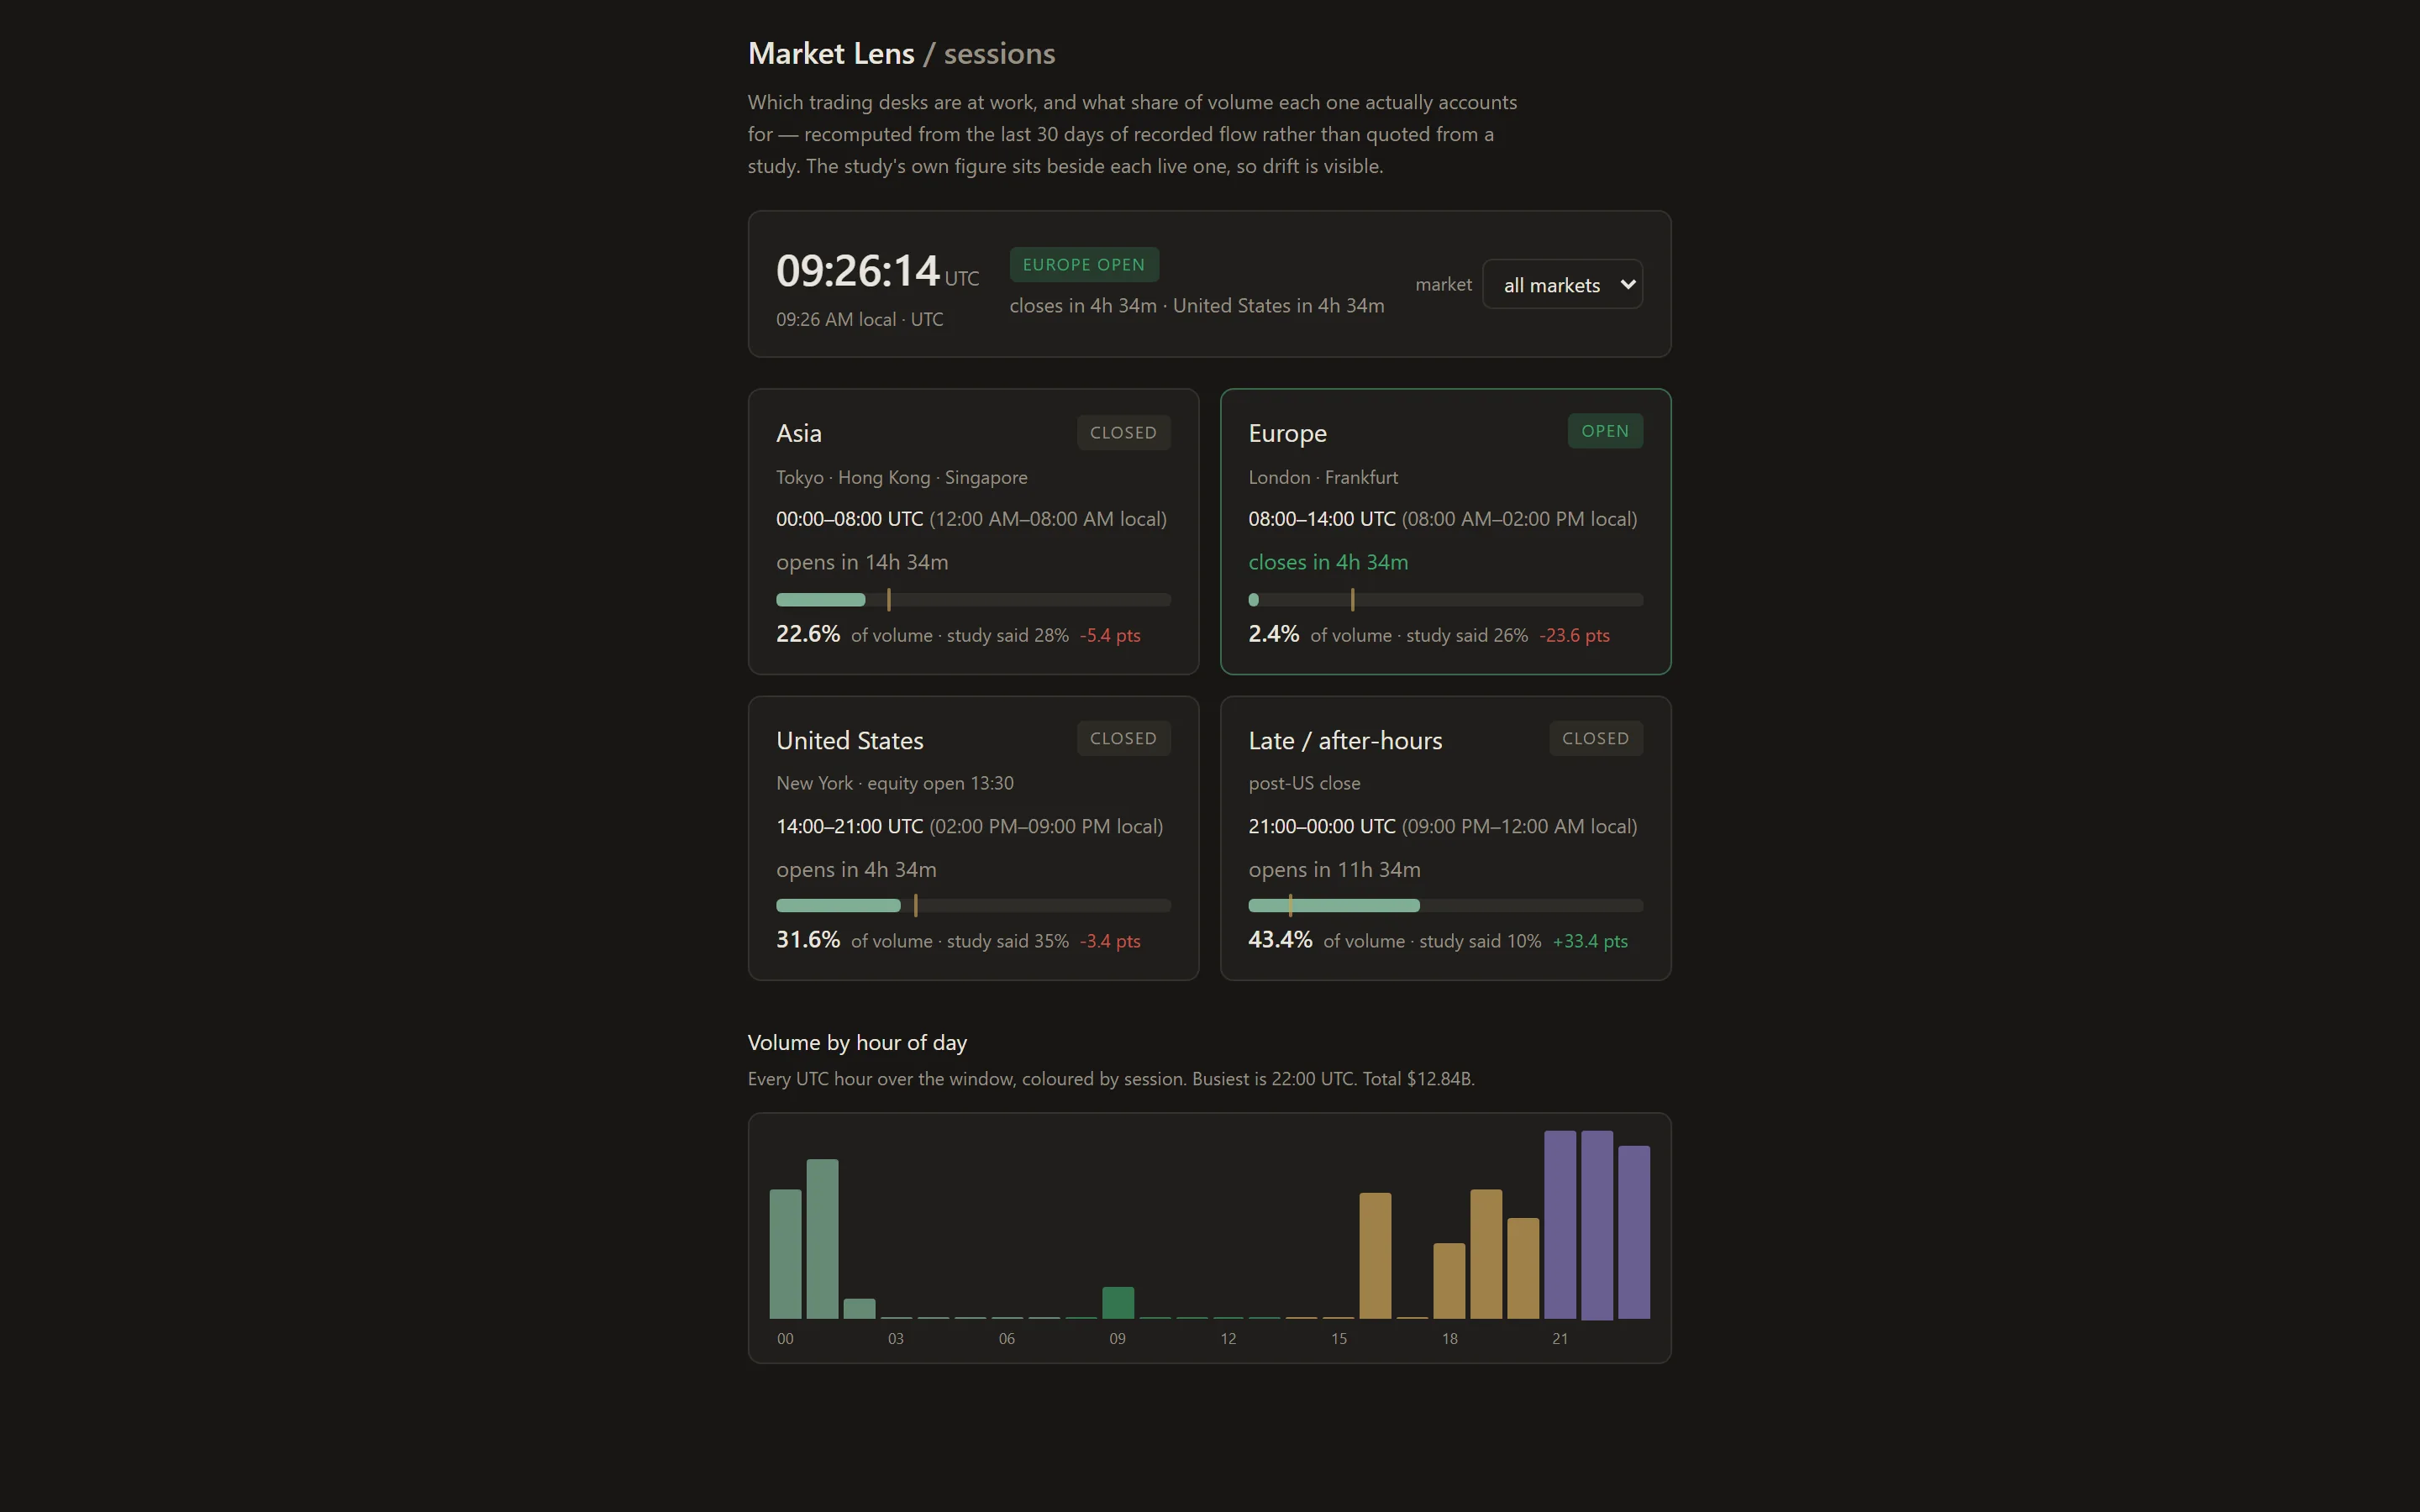
The trading-hub clock — Asia, Europe, United States, after-hours — with each hub's share of volume measured from the last 30 days of recorded flow rather than quoted from folklore. The study's own figure sits beside each live one so drift is visible.

The sessions page: the current UTC time, which hub is open, four session cards with live volume shares, and a volume-by-hour chart coloured by session.

Venues

One failure-isolated adapter per feed. A venue going quiet costs its own data, never anyone else's. Fifty-two symbols are recorded around the clock, watched or not — book history cannot be backfilled.

How it works

Collector

One asyncio Python process. Venue adapters feed a delta-maintained book per market; aggregation bins the merged depth and broadcasts it over a WebSocket once a second, with trades streamed as they print.

Archive

SQLite in WAL mode: binned depth snapshots, large prints, per-minute flow, open-interest observations, forced liquidations. Per-table retention — and liquidation prints are never pruned, because that history has no free source anywhere.

Interface

React and TypeScript, built with Vite, served as static files by the collector itself. No server rendering, no Node in production, no API keys — only public market-data streams.

Questions

Is Market Lens free?
Yes. It is open source under AGPL-3.0 and runs on your own machine using only public market-data feeds — no API keys and no account.
Which exchanges does it aggregate?
Binance, Bybit, OKX, Hyperliquid, Coinbase, Kraken, Bitget, Deribit and Gate.io — spot and perpetual books merged into one ladder, with forced-liquidation streams from Binance and OKX futures.
Is this financial advice or a signal service?
No. Market Lens is a visualization and measurement instrument. Nothing it shows is a recommendation to buy or sell. Resting orders are claims that can be pulled; only executed trades are facts, and the tool keeps the two visually distinct.
What does it record?
Binned depth snapshots, large prints, per-minute flow, open-interest observations and forced liquidations, in SQLite. Liquidation history is never pruned, because no venue sells it back.

Not financial advice

Market Lens is a visualization and measurement instrument. Markets — crypto especially — are volatile, and nothing shown by this tool is a recommendation to buy or sell anything. Every layer has limits, and the in-app documentation is explicit about them: depth is what venues choose to display, liquidation maps are estimates, and a wall is a claim until it trades.